REPORTING TOOL · LIVE
ADO Reporting Dashboard
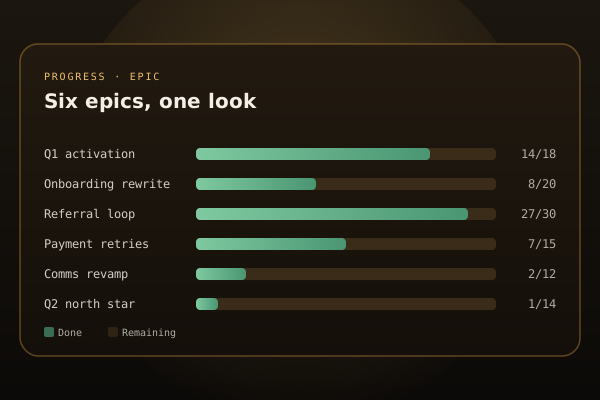
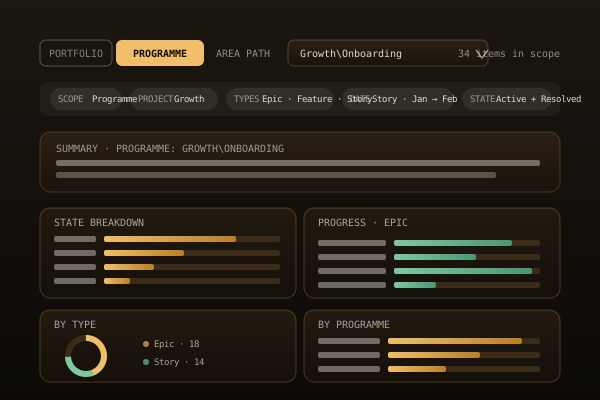
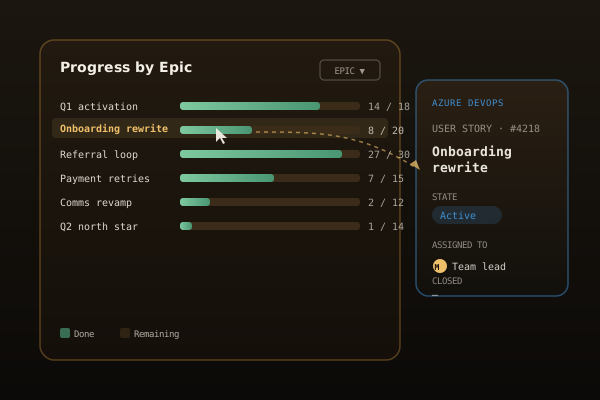
Roll your Azure DevOps work items up into a portfolio or programme report without leaving the browser. Paste a PAT, pick a project, and the tool fetches your Epic → Feature → Story tree through a server-side proxy, buckets items by the field you nominate as the programme axis, and lays out four widgets — status, type mix, per-container progress, and per-programme volume. Each widget lets you narrow to one work-item type; a scoped date filter targets one type while its parents and descendants come through unfiltered. Free-text summaries and per-view labels persist locally.
▶ Open the toolHow it works
PAT
auth (org + project)
Portfolio
or one programme
Local
config + summaries
HOW A REPORT COMES TOGETHER
Connect
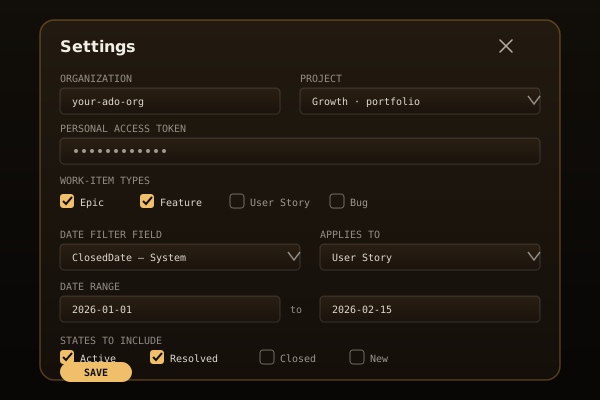
Paste a Work-Items-Read PAT, pick the org + project. Live-fetched pickers replace typing reference names.
Configure
Choose which work-item types to include, which field buckets programmes, and an optional date filter targeting one type.
Read the report
Switch between Portfolio and a single Programme; add narrative in the summary; every widget respects the filters live.