
ENERGY TOOL · DEMO
Energy Analyser
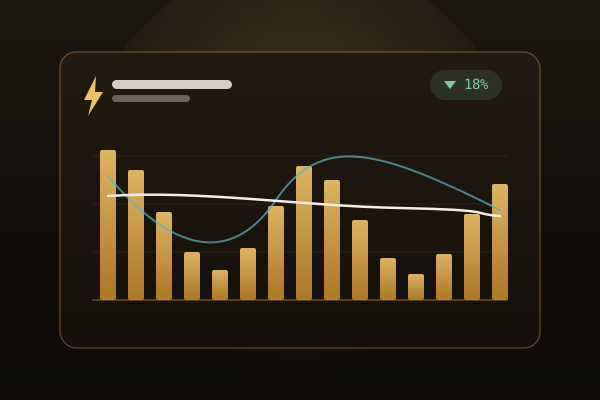
Winter always looks worse than summer — so is your energy use actually creeping up, or is it just cold outside? Connect your Octopus account or load three years of sample data, and the Energy Analyser plots your electricity and gas over time with the seasonal swing stripped out, so the real trend is obvious. It's a demo: nothing is stored.
▶ Open the demoHow it works
Octopus
or sample data
3 yrs
of daily usage
Zero
data stored
HOW IT WORKS
Bring your data
Connect your Octopus account, or load a realistic multi-year sample with one click — no account needed.
See the shape
Electricity and gas plotted over time — by day, week or month — with the heavy seasonal swing laid bare.
Read the real trend
Year-on-year and rolling comparisons strip out seasonality, so you can tell if you're genuinely using more or less.